DANL 200: Introduction to Data Analytics
DANL 200 - Final Exam - Practice
Byeong-Hak Choe
2023-02-14
Loading R packages for the Practice Final Exam
library(tidyverse)
library(lubridate)
Question 1
Sponsored or paid search refers to the advertisements and links that you see around web search results on, for example, Google.
eBay stopped bidding on any AdWords (the marketplace through which Google’s paid search is sold) for 65 of the 210 “designated markets” (DM) in the U.S. for the eight weeks following May 22, 2012. Google guesses the DM on a web browser and eBay can track users by their shipping address, allowing for DM-specific paid-search turnoff and response tracking.
Assume that nothing other than the eBay’s paid-search status changes eBay’s sales revenue across the DM after May 22, 2012.
The data set for Question 1 is imported by the following read_csv() function:
paidsearch <- read_csv(
'https://bcdanl.github.io/data/paidsearch.csv')- Variable description
dma: an identification number of a designated marketi(e.g., Boston, Los Angeles)treatment_period: 0 if date is before May 22, 2012 and 1 after.search_stays_on: 1 if the paid-search goes off in dmai, 0 otherwise.revenue: eBay’s sales revenue for dmaiand datet
Q1a.
Summarize the mean vale of revenue for each group of
search_stays_on and for each date.
Q1a <- paidsearch %>%
  group_by(search_stays_on, date) %>%
  summarise(revenue = mean(revenue))
Q1b
Calculate the log difference between mean revenues in each group of
search_stays_on. (This is the log of the average revenue in
group of search_stays_on == 1 minus the log of the average revenue in
group of search_stays_on == 0.)
- For example, consider the following two observations:
# date        the daily mean vale of `revenue`   search_stays_on
# 1-Apr-12    93650.68                           0
# 1-Apr-12 120277.57 1- The log difference of daily mean revenues between the two group of
search_stays_onfor date 1-Apr-12 is log(120277.57) - log(93650.68).
Q1b <- paidsearch %>%
  mutate(date = dmy(date)) %>%
  arrange(dma, date)


paidsearch_sum <- Q1b %>%
  group_by(search_stays_on, date) %>%
  summarise(revenue = mean(revenue))


paidsearch_sum2 <- paidsearch_sum %>%
  arrange(date, search_stays_on) %>%
  pivot_wider(names_from = "search_stays_on",
              values_from = "revenue") %>%
  rename(rev_control = `0`,
         rev_treat = `1`) %>%
  mutate(diff_log = log(rev_control) - log(rev_treat))
Q1c
Describe the daily trend of the log of the daily mean revenue for each group of
search_stays_onbefore and after May 22, 2012 in one plot using lubridate and ggplot2.Describe the daily trend of the log difference of daily mean revenues between the two group of
search_stays_onbefore and after May 22, 2012 using lubridate and ggplot2.Make a simple comment on your ggplot results.
ggplot(data = paidsearch_sum2) +
  geom_line(aes(x = date, y = diff_log)) +
  geom_vline(aes(xintercept=ymd("2012-May-22")),
             color = "black", lty  = 2)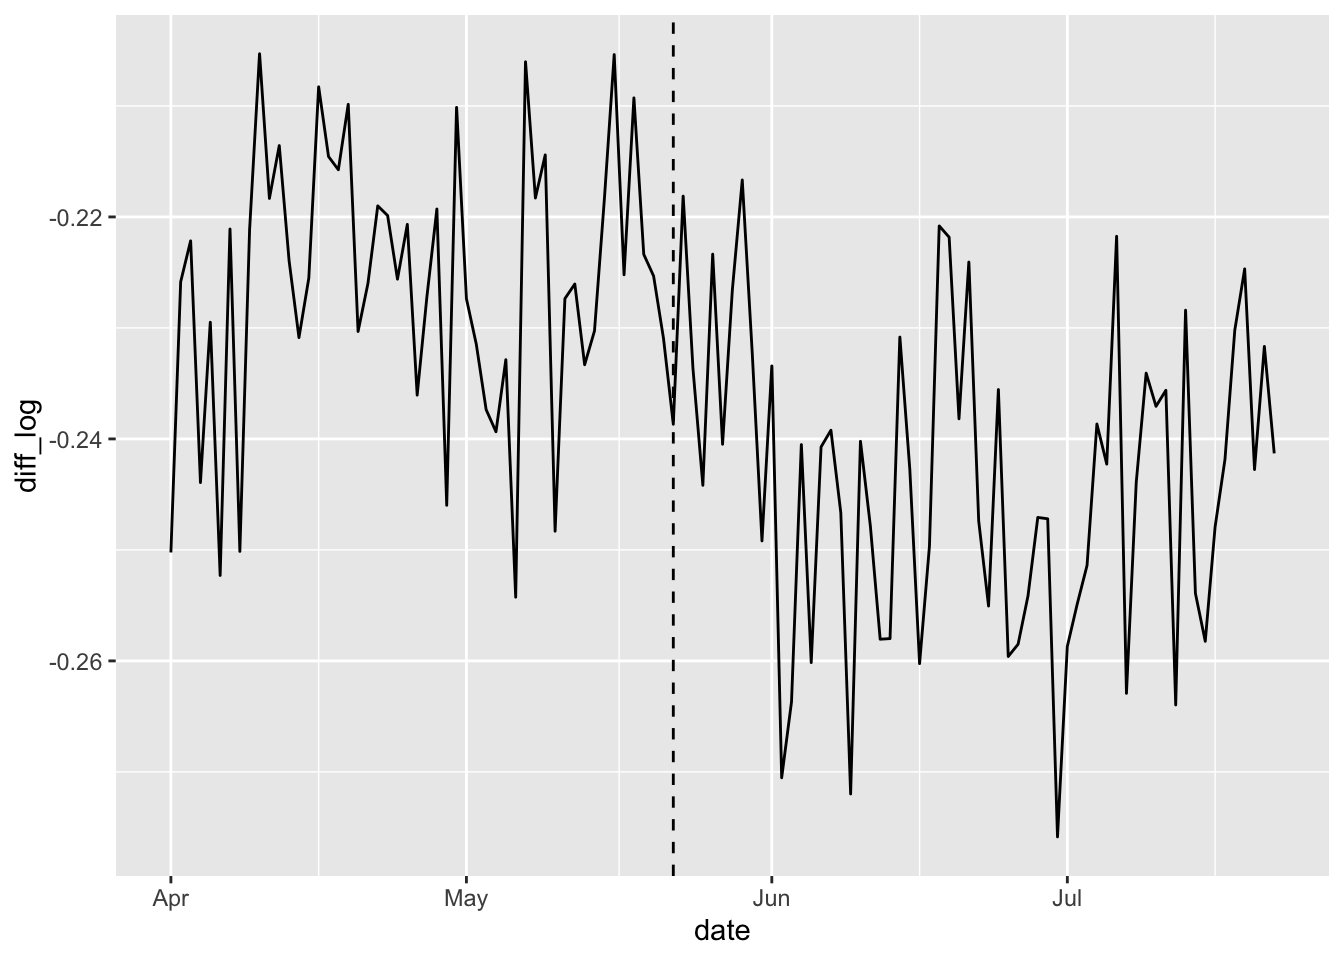
ggplot(data = paidsearch_sum2) +
  geom_line(aes(x = date, y = rev_control), color = 'red') +
  geom_line(aes(x = date, y = rev_treat)) +
  geom_vline(aes(xintercept=ymd("2012-May-22")),
             color = "black", lty  = 2)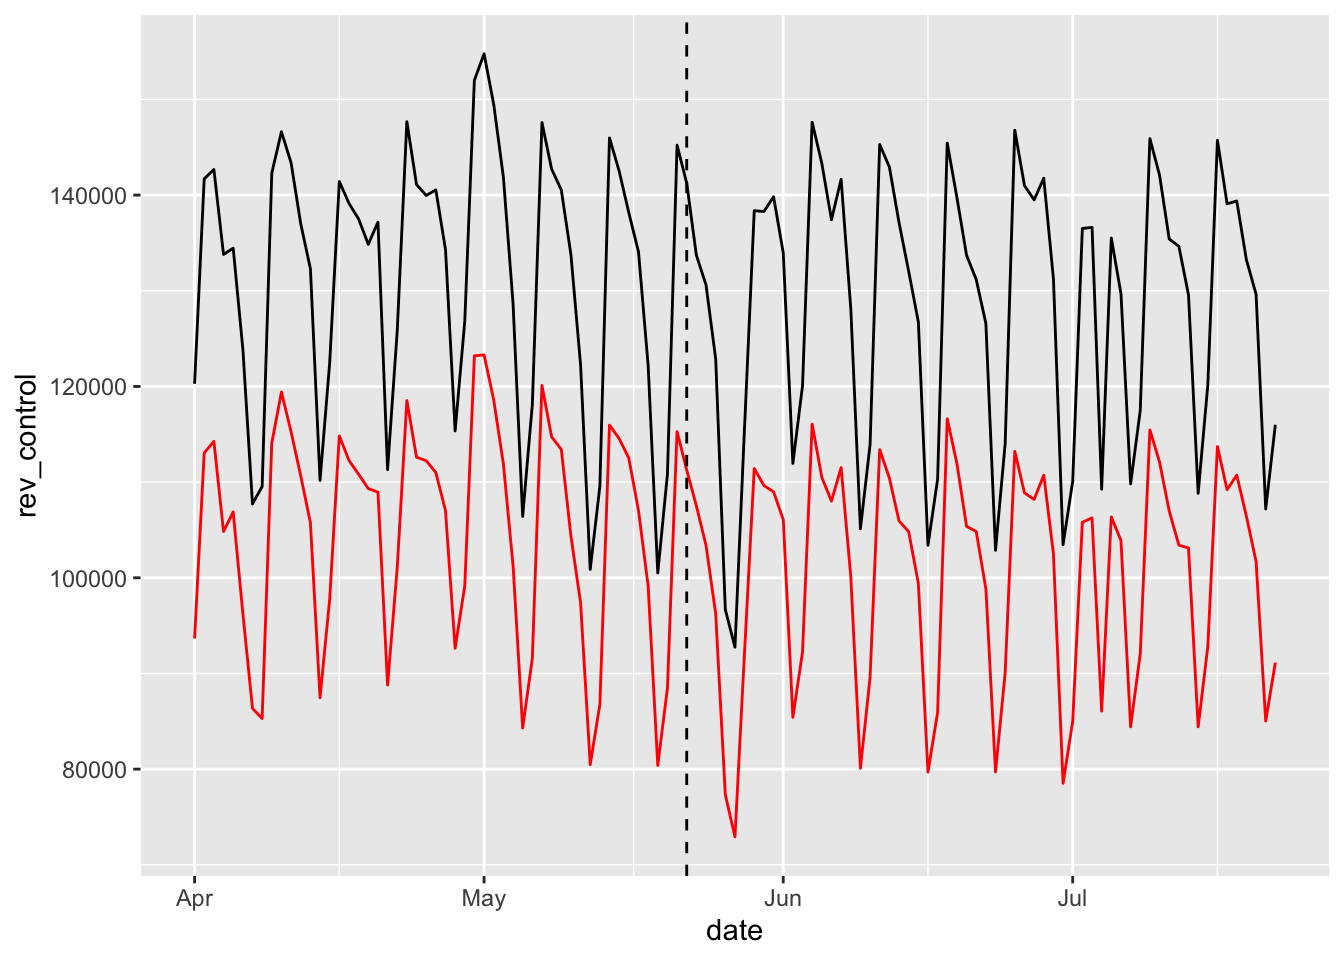
ggplot() +
  geom_line(data = filter(paidsearch_sum, search_stays_on == 0)  ,
            aes(x = date, y = log(revenue)), color = 'blue')+
  geom_line(data = filter(paidsearch_sum, search_stays_on == 1)  ,
            aes(x = date, y = log(revenue)), color = 'red')+
  geom_vline(aes(xintercept=ymd("2012-May-22")),
             color = "black", lty  = 2)+
  geom_smooth(data = filter(paidsearch_sum,
                            date <= ymd("2012-May-22")),
              aes(x = date, y = log(revenue)),
              method = lm, lty = 4, se = F) +
  geom_smooth(data = filter(paidsearch_sum,
                            date >= ymd("2012-May-22")),
              aes(x = date, y = log(revenue)),
              color = "red",
              method = lm, lty = 4, se = F) +
  geom_smooth(data = filter(paidsearch_sum,
                            date <= ymd("2012-May-22")),
              aes(x = date, y = log(revenue))) +
  geom_smooth(data = filter(paidsearch_sum,
                            date >= ymd("2012-May-22")),
              aes(x = date, y = log(revenue)),
color = "red") 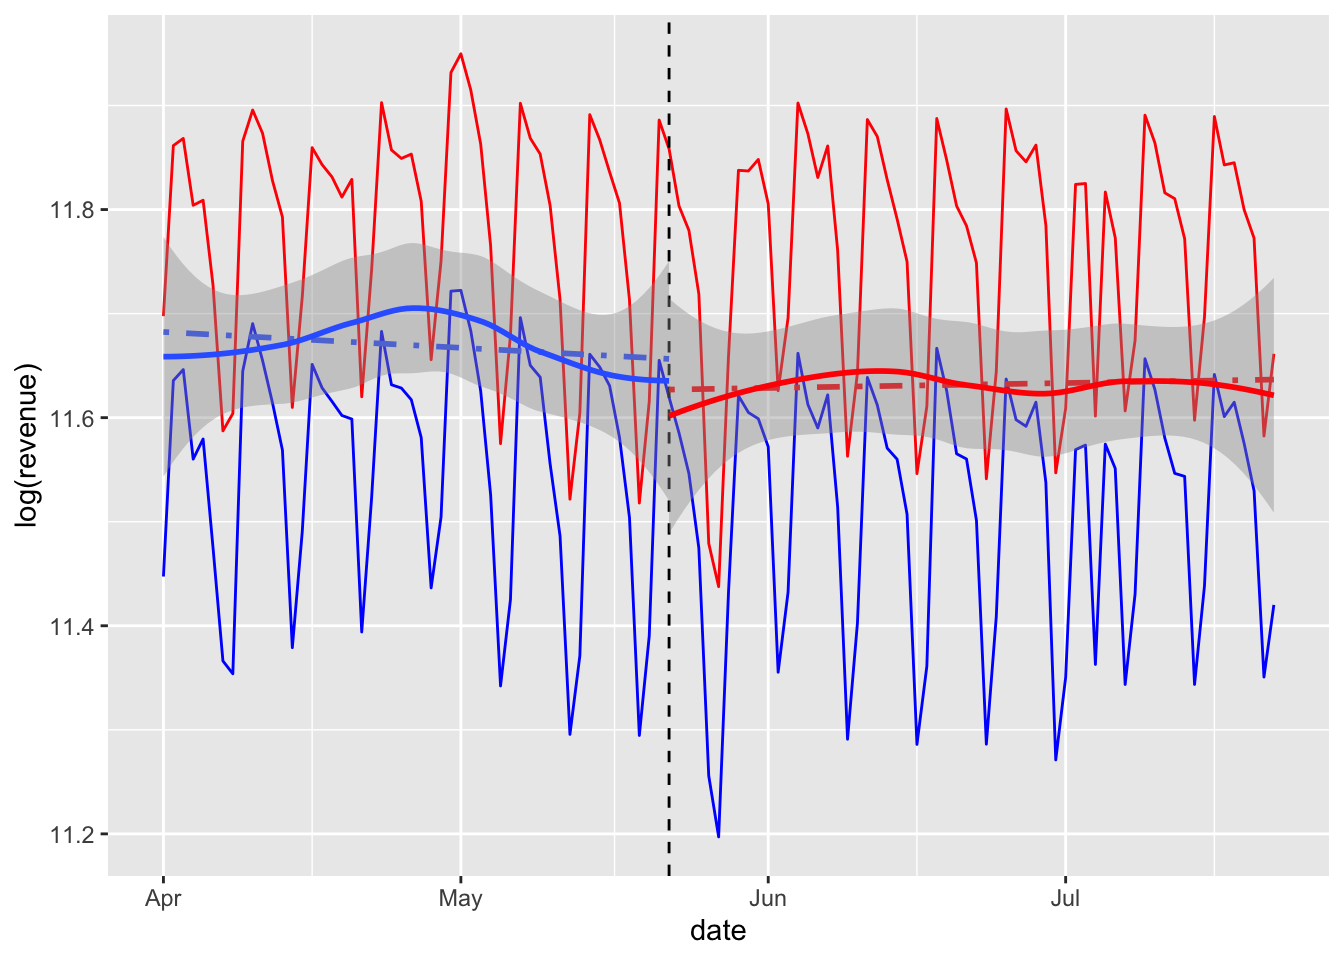
- There might not be a significant effect of turning off search engine marketing on eBay’s sales revenue.
For the rest of questions in Question 1, use the following data.frame:
paid_search <- read_csv(
  'https://bcdanl.github.io/data/paid_search.csv')

paid_search$DM <- as.factor(paid_search$DM)
paid_search <- arrange(paid_search, DM, no_paid_search)- For the questions here, do not divide the data.frame,
paid_search, into training and testing data sets.
- Variable description
DM: an identification number of a designated market i (e.g., Boston, Los Angeles)May22_2012: 0 denotes before May 22 and May22_2012 = 1 after.no_paid_search: 1 if the paid-search goes off in DM, no_paid_search = 0 otherwise.log_revenue: the log of eBay’s sales revenue for DM i and time t
Q1d
Consider the following linear regression model.
dm_reg1 <- lm(log_revenue ~  no_paid_search * May22_2012,
data = paid_search )- Report the regression result.
summary(dm_reg1) ##
## Call:
## lm(formula = log_revenue ~ no_paid_search * May22_2012, data = paid_search)
##
## Residuals:
## Min 1Q Median 3Q Max
## -3.8518 -0.7061 -0.0447 0.7696 3.6521
##
## Coefficients:
## Estimate Std. Error t value Pr(>|t|)
## (Intercept) 10.948646 0.100495 108.948 <2e-16 ***
## no_paid_search 0.014081 0.176603 0.080 0.936
## May22_2012 -0.039400 0.142121 -0.277 0.782
## no_paid_search:May22_2012 -0.006587 0.249754 -0.026 0.979
## ---
## Signif. codes: 0 '***' 0.001 '**' 0.01 '*' 0.05 '.' 0.1 ' ' 1
##
## Residual standard error: 1.198 on 416 degrees of freedom
## Multiple R-squared: 0.0003231, Adjusted R-squared: -0.006886
## F-statistic: 0.04482 on 3 and 416 DF, p-value: 0.9874Q1e
Describe the model in Q1d in words.
Q1f
On average, are the predictions correct in the model in Q1d? Are there systematic errors?
Q1g
Describe the following model in words.
formula <- log_revenue ~ no_paid_search * May22_2012 + DMQ1h
Estimate the following linear regression model.
dm_reg2 <- lm(log_revenue ~  no_paid_search * May22_2012 + DM,
              data = paid_search )
stargazer::stargazer(dm_reg1, dm_reg2,
                     type = 'html',
omit = c("DM"))| Dependent variable: | ||
| log_revenue | ||
| (1) | (2) | |
| no_paid_search | 0.014 | -0.227*** |
| (0.177) | (0.027) | |
| May22_2012 | -0.039 | -0.039*** |
| (0.142) | (0.003) | |
| no_paid_search:May22_2012 | -0.007 | -0.007 |
| (0.250) | (0.006) | |
| Constant | 10.949*** | 11.453*** |
| (0.100) | (0.019) | |
| Observations | 420 | 420 |
| R2 | 0.0003 | 1.000 |
| Adjusted R2 | -0.007 | 0.999 |
| Residual Std. Error | 1.198 (df = 416) | 0.027 (df = 208) |
| F Statistic | 0.045 (df = 3; 416) | 3,961.530*** (df = 211; 208) |
| Note: | p<0.1; p<0.05; p<0.01 | |
- Interpret the beta estimates for the following variables:
no_paid_searchMay22_2012no_paid_search:May22_2012
Q1i
On average, are the predictions correct in the model in Q1h? Are there systematic errors?
Q1j
What would happen to sales revenue if eBay stopped paying for search advertising? Would eBay’s search advertising worth the cost?