class: title-slide, left, bottom # Lecture 26 ---- ## **DANL 200: Introduction to Data Analytics** ### Byeong-Hak Choe ### December 6, 2022 --- # Announcement ### <p style="color:#00449E"> Student Course Experience (SCE) Survey - Effective Fall 2022, the Student Course Experience (SCE) survey replaces the Student Observation of Faculty Instruction (SOFI) survey. - In a web browser, students should visit their [myGeneseo](https://my.geneseo.edu/dashboard) portal, then select KnightWeb, Surveys, then SCE (formerly SOFI) Surveys. --- # Announcement ### <p style="color:#00449E"> Final Exam - Final Exam Schedule is mentioned in page 2 in our syllabus. - School's Final Exam Schedule is available [here](https://www.geneseo.edu/sites/default/files/sites/registrar/2022.03.30%20202209%20Exam%20Schedule.pdf). - Final Exam covers the following topics: - Loading CSV files - Summary Statistics - Data Visualization - Data Transformation - Pivoting/Separating/Uniting/Joining - String/Factor/Date-Time Data - Linear Regression --- class: inverse, center, middle # Linear Regression using **R** <html><div style='float:left'></div><hr color='#EB811B' size=1px width=796px></html> --- # Linear Regression in R ### <p style="color:#00449E"> R commands to do EDA and linear regression analysis .panelset[ .panel[.panel-name[Data] ```r library(tidyverse) psub <- readRDS( url('https://bcdanl.github.io/data/psub.RDS') ) set.seed(54321) gp <- runif( nrow(psub) ) # Set up factor variables if needed. dtrain <- filter(psub, gp >= .5) dtest <- filter(psub, gp < .5) ``` ] .panel[.panel-name[EDA] ```r library(skimr) sum_dtrain <- skim( select(dtrain, PINCP, AGEP, SEX, SCHL) ) library(GGally) ggpairs( select(dtrain, PINCP, AGEP, SEX, SCHL) ) # MORE VISUALIZATIONS ARE RECOMMENDED ``` ] .panel[.panel-name[Training] ```r model_1 <- lm( PINCP ~ AGEP + SEX, data = dtrain ) model_2 <- lm( PINCP ~ AGEP + SEX + SCHL, data = dtrain ) ``` ] .panel[.panel-name[Summary 1] - Summary with base-R: ```r summary(model_1) summary(model_2) coef(model_1) coef(model_2) # Using the model.matrix() function on our linear model object, # we can get the data matrix that underlies our regression. df_model_1 <- as_tibble( model.matrix(model_1) ) df_model_2 <- as_tibble( model.matrix(model_2) ) ``` ] .panel[.panel-name[Summary 2] - Summary with R packages: ```r # install.packages(c("stargazer", "broom")) library(stargazer) library(broom) stargazer(model_1, model_2, type = 'text') # from the stargazer package sum_model_2 <- tidy(model_2) # from the broom package # Consider filter() to keep statistically significant beta estimates ``` ] .panel[.panel-name[Betas in plot] ```r ggplot(sum_model_2) + geom_pointrange( aes(x = term, y = estimate, ymin = estimate - 2*std.error, ymax = estimate + 2*std.error ) ) + coord_flip() ``` ] .panel[.panel-name[Prediction] ```r dtest <- dtest %>% mutate( pred_1 = predict(model_1, newdata = dtest), pred_2 = predict(model_2, newdata = dtest) ) ``` ] .panel[.panel-name[Actual vs. Prediction Plot] ```r ggplot( data = dtest, aes(x = pred_2, y = PINCP) ) + geom_point( alpha = 0.2, color = "darkgray" ) + geom_smooth( color = "darkblue" ) + geom_abline( color = "red", linetype = 2 ) # y = x, perfect prediction line ``` ] .panel[.panel-name[Residual Plot] ```r ggplot(data = dtest, aes(x = pred_2, y = PINCP - pred_2)) + geom_point(alpha = 0.2, color = "darkgray") + geom_smooth( color = "darkblue" ) + geom_hline( aes( yintercept = 0 ), # perfect prediction color = "red", linetype = 2) ``` ] ] --- # Linear Regression in R ### <p style="color:#00449E"> The model equation `$$\texttt{PINCP[i]}\qquad\qquad\qquad\qquad\qquad\notag\\ \;=\;\; \texttt{b0} \,+\, \texttt{b1*AGEP[i]} \,+\, \texttt{b2*SEX.Male[i]}\\ \qquad\qquad\texttt{b3*SCHL.no high school diploma[i]}\,+\, \\ \qquad\qquad\qquad\quad\;\texttt{b4*SCHL.GED or alternative credential[i]}\,+\, \\ \qquad\qquad\qquad\quad\;\;\texttt{b5*SCHL.some college credit, no degree[i]}\,+\, \\ \qquad\texttt{b6*SCHL.Associate's degree[i]}\,+\, \\ \quad\;\;\texttt{b7*SCHL.Bachelor's degree[i]}\,+\, \\ \;\;\,\texttt{b8*SCHL.Master's degree[i]}\,+\, \\ \qquad\;\;\;\texttt{b9*SCHL.Professional degree[i]}\,+\, \\ \qquad\texttt{b10*SCHL.Doctorate degree[i]}\,+\, \\ \,\texttt{e[i]}.\qquad\qquad\qquad\qquad\qquad$$` --- class: inverse, center, middle # Linear Regression with Log-transformed Variables <html><div style='float:left'></div><hr color='#EB811B' size=1px width=796px></html> --- # Linear Regression with Log-transformtion ### <p style="color:#00449E"> A Little Bit of Math for Logarithm and Exponential Functions .pull-left[ 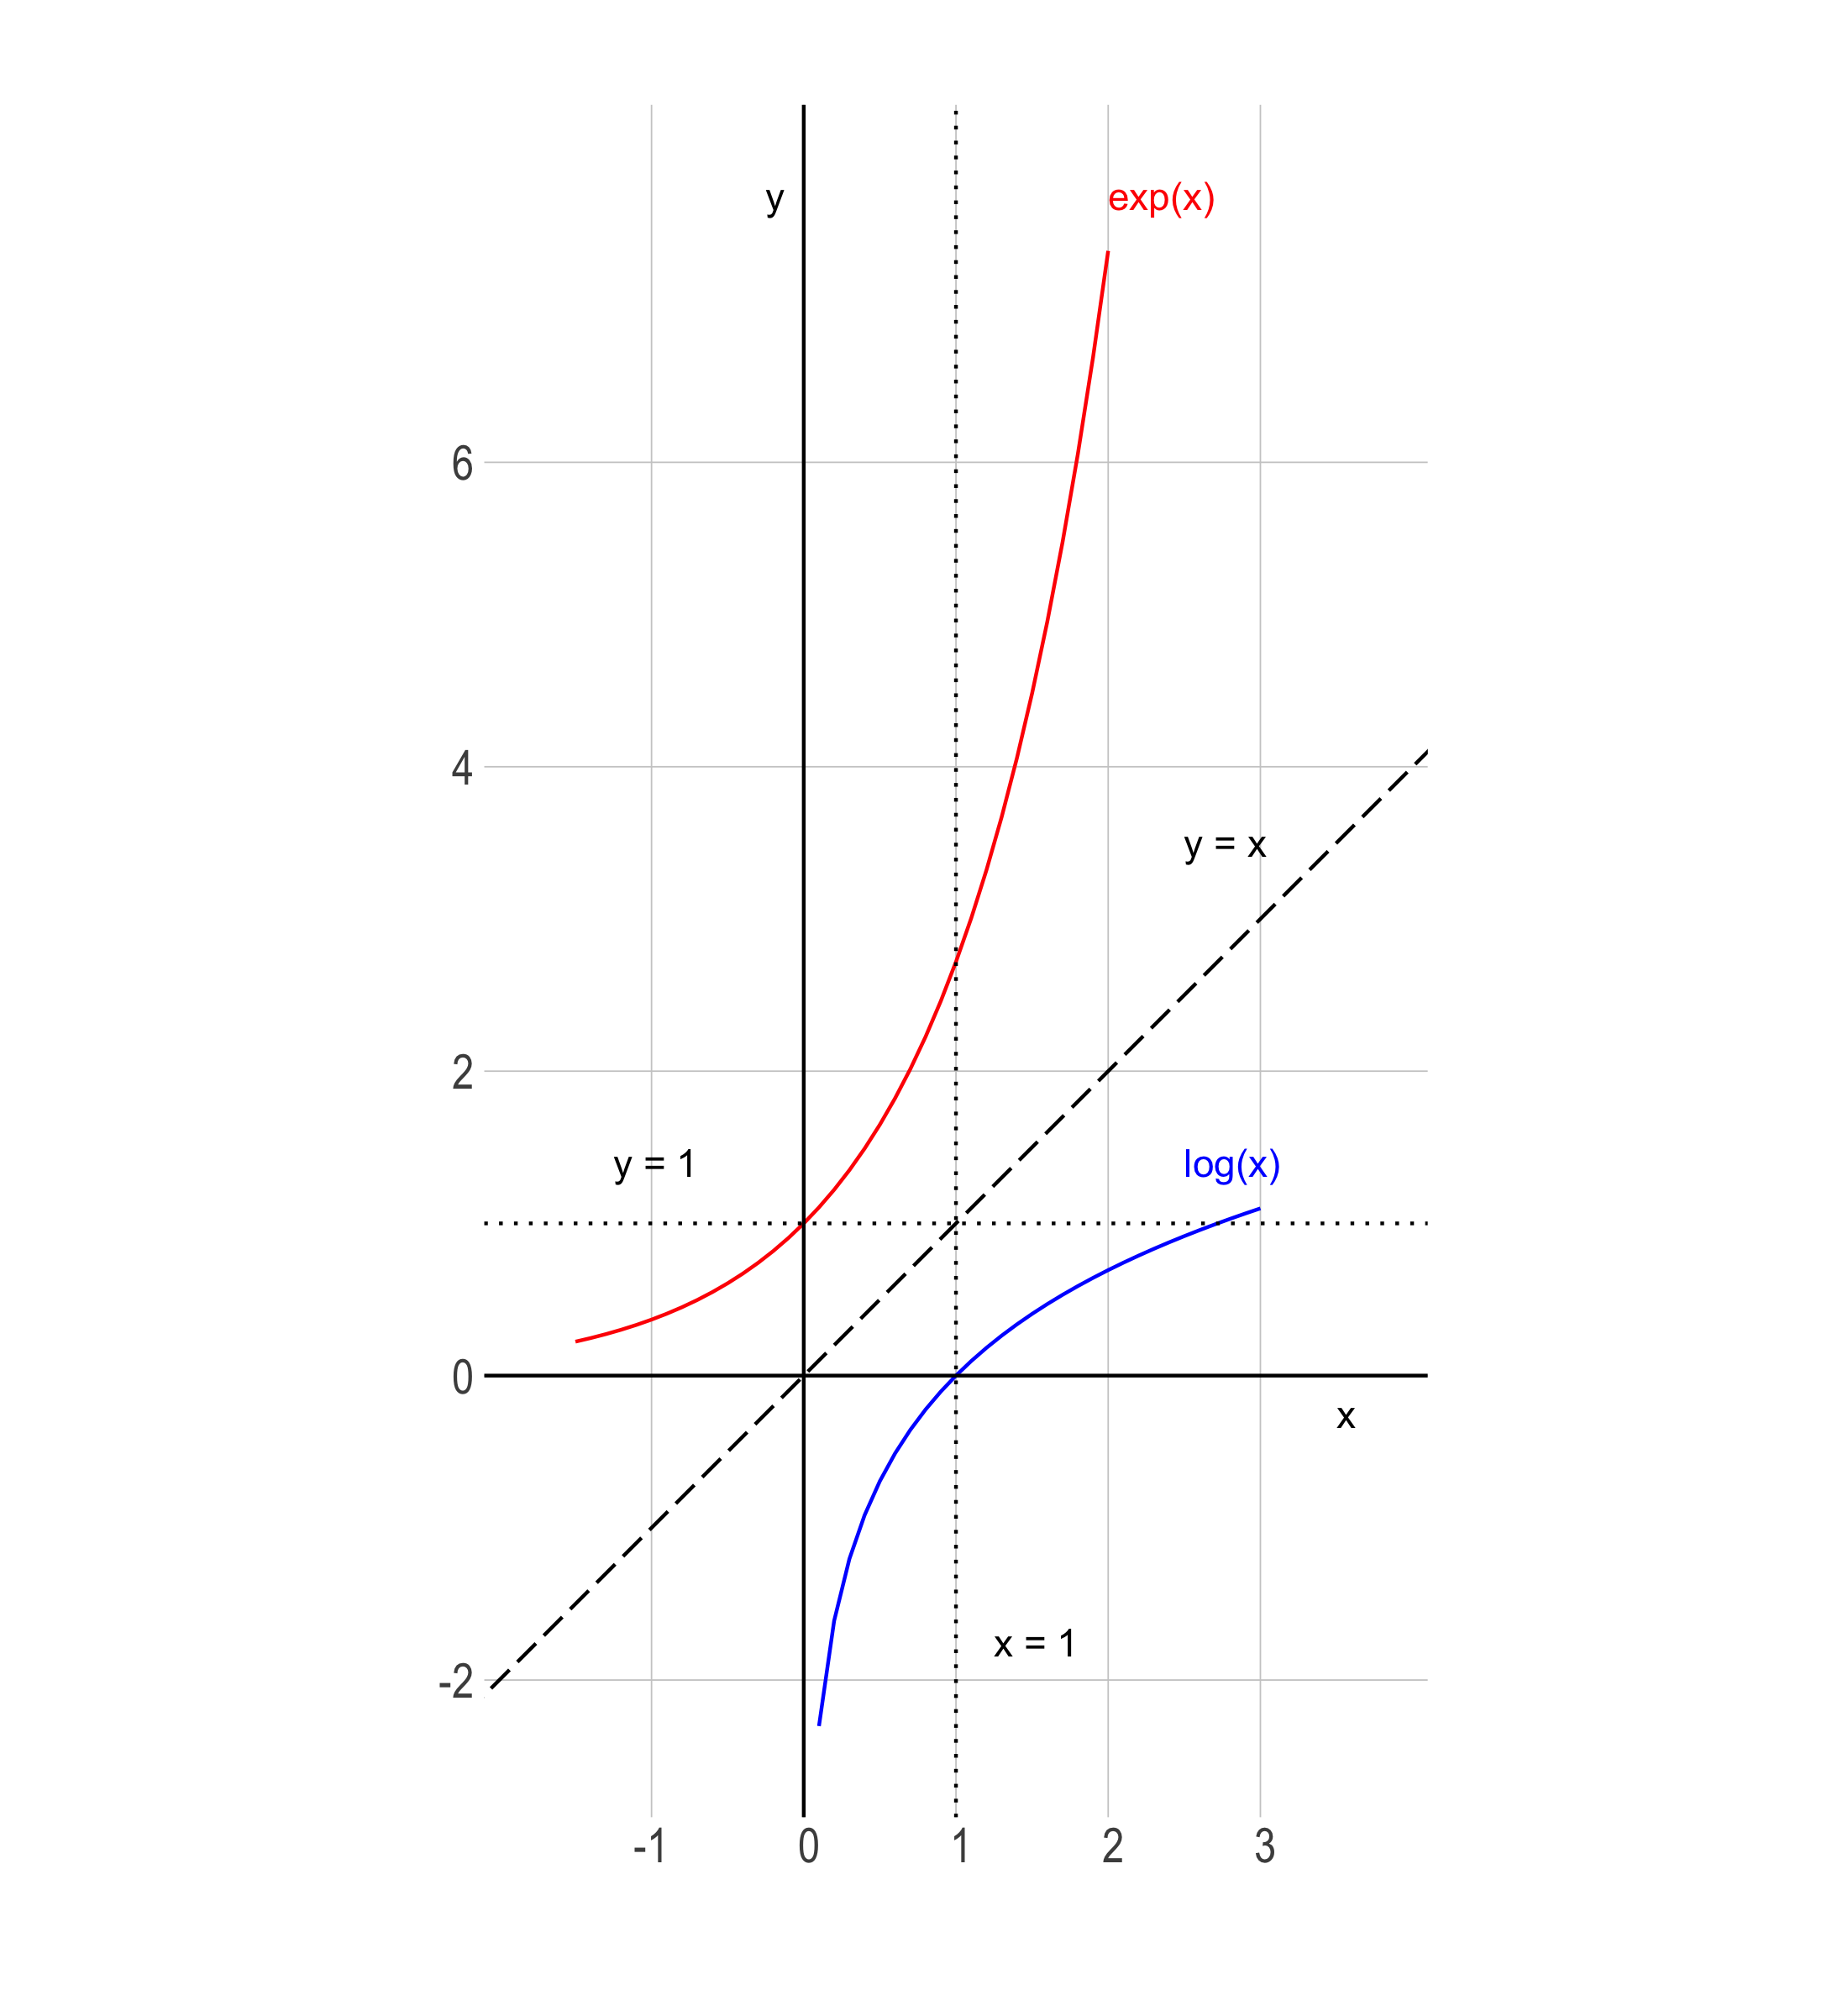<!-- --> ] .pull-right[ - `\(\log_{e}\,(\,x\,)\)`: the base `\(e\)` logarithm is called **the natural log**, where `\(e = 2.718\cdots\)` is the mathematical constant, the Euler's number. - `\(\log\,(\,x\,)\)` or `\(\ln\,(\,x\,)\)`: the natural log of `\(x\)`. - `\(e^x\)` or `\(exp(x)\)`: the base `\(e\)` exponential function of `\(x\)`. ] --- # Linear Regression with Log-transformtion - We should use a logarithmic scale when **percent change**, or change in orders of magnitude, is more important than changes in absolute units. - For small changes in variable `\(x\)` from `\(x_{0}\)` to `\(x_{1}\)`, the following equation holds: `$$\Delta \log(x) \,= \, \log(x_{1}) \,-\, \log(x_{0}) \approx\, \frac{x_{1} \,-\, x_{0}}{x_{0}} \,=\, \frac{\Delta\, x}{x_{0}}.$$` - A change in income of $5,000 means something very different across people with different income levels. - A percentage change in income, e.g., 5% of income, may mean somewhat more similar across people with different income levels. - We can also consider using a log scale to reduce a variance of residuals when a variable is heavily skewed. --- # Linear Regression with Log-transformtion - The log transformation makes the skewed distribution of income more normal. ```r ggplot(dtrain, aes( x = PINCP ) ) + geom_density() ggplot(dtrain, aes( x = log(PINCP) ) ) + geom_density() ``` --- # Linear Regression with Log-transformtion ### <p style="color:#00449E"> A Few Algebras for Logarithm and Exponential Functions - Rule 1: $$\texttt{y} \,=\, \texttt{log(x)}\qquad\Leftrightarrow\qquad \texttt{exp(y)} \,=\, \texttt{x}. $$ - Rule 2: `$$\texttt{log(x)} \,-\, \texttt{log(z)} \,=\, \texttt{log}\,\left(\,\frac{\texttt{x}}{\texttt{z}}\,\right).$$` - By the rules above, $$ \texttt{log(x)} \,-\, \texttt{log(z)} \,=\, \texttt{b}\qquad\Leftrightarrow\qquad \frac{\texttt{x}}{\texttt{z}} \,=\,\texttt{exp(b)}. $$ --- # Linear Regression with Log-transformtion - Let's consider the following linear regression model: `$$\qquad\log(\texttt{PINCP[i]})\qquad\qquad\qquad\qquad\\ \;=\;\; \texttt{b0} \,+\, \texttt{b1*AGEP[i]} \,+\, \texttt{b2*SEX.Male[i]}\\ \qquad\qquad\texttt{b3*SCHL.no high school diploma[i]}\,+\, \\ \qquad\qquad\qquad\quad\;\texttt{b4*SCHL.GED or alternative credential[i]}\,+\, \\ \qquad\qquad\qquad\quad\;\;\texttt{b5*SCHL.some college credit, no degree[i]}\,+\, \\ \qquad\texttt{b6*SCHL.Associate's degree[i]}\,+\, \\ \quad\;\;\texttt{b7*SCHL.Bachelor's degree[i]}\,+\, \\ \;\;\,\texttt{b8*SCHL.Master's degree[i]}\,+\, \\ \qquad\;\;\;\texttt{b9*SCHL.Professional degree[i]}\,+\, \\ \qquad\texttt{b10*SCHL.Doctorate degree[i]}\,+\, \\ \,\texttt{e[i]}.\qquad\qquad\qquad\qquad\qquad$$` --- # Linear Regression with Log-transformtion ### <p style="color:#00449E"> Interpreting Beta Estimates - Consider `\(\texttt{Bob}\)` and `\(\texttt{Ben}\)`: - `\(\texttt{AGEP[Bob]} = 51\)` and `\(\texttt{AGEP[Ben]} = 50\)` - `\(\texttt{SEX[Bob]} = \texttt{SEX[Ben]} = \texttt{"Male"}\)` - `\(\texttt{SCHL[Bob]} = \texttt{SCHL[Ben]} = \texttt{"Bachelor's degree"}\)` - Consider `\(\texttt{Linda}\)` and `\(\texttt{Ben}\)`: - `\(\texttt{SEX[Linda]} = \texttt{"Female"}\)` and `\(\texttt{SEX[Ben]} = \texttt{"Male"}\)` - `\(\texttt{SCHL[Linda]} = \texttt{SCHL[Ben]} = \texttt{"Bachelor's degree"}\)` - `\(\texttt{AGEP[Linda]} = \texttt{AGEP[Ben]} = 50\)` --- # Linear Regression with Log-transformtion ### <p style="color:#00449E"> Interpreting Beta Estimates - If we apply the rule above for `\(\texttt{Bob}\)` and `\(\texttt{Ben}\)`'s predicted incomes, `$$\widehat{\texttt{log(PINCP[Ben]})} \,-\, \widehat{\texttt{log(PINCP[Bob])}}\qquad \\ \;=\quad \hat{\texttt{b1}}\texttt{ * }(\texttt{AGEP[Ben]} - \texttt{AGEP[Bob]})\qquad\\ \;=\quad \hat{\texttt{b1}}\texttt{ * }\texttt{(51 - 50)}\qquad\qquad\qquad\qquad\;\\ \;=\quad \hat{\texttt{b1}}\qquad\qquad\qquad\qquad\qquad\qquad\;\;\;\,$$` So we can have the following: `$$\frac{\widehat{\texttt{PINCP[Ben]}}}{ \widehat{\texttt{PINCP[Bob]}}} \;=\; \texttt{exp(}\hat{\texttt{b1}}\texttt{)} \quad\Leftrightarrow\quad\widehat{\texttt{PINCP[Ben]}} \;=\; \widehat{\texttt{PINCP[Bob]}} * \texttt{exp(}\hat{\texttt{b1}}\texttt{)}$$` --- # Linear Regression with Log-transformtion ### <p style="color:#00449E"> Interpreting Beta Estimates - If we apply the rule above for `\(\texttt{Ben}\)` and `\(\texttt{Linda}\)`'s predicted incomes, `$$\frac{\widehat{\texttt{PINCP[Ben]}}}{ \widehat{\texttt{PINCP[Linda]}}} \;=\; \texttt{exp(}\hat{\texttt{b2}}\texttt{)} \quad\Leftrightarrow\quad\widehat{\texttt{PINCP[Ben]}} \;=\; \widehat{\texttt{PINCP[Linda]}} * \texttt{exp(}\hat{\texttt{b2}}\texttt{)}$$` - Suppose `\(\texttt{exp(}\hat{\texttt{b2}}\texttt{)} = 1.18\)`. - Then `\(\widehat{\texttt{PINCP[Ben]}}\)` is 1.18 times `\(\widehat{\texttt{PINCP[Linda]}}\)`. - It means that being a male is associated with an increase in income by 18% relative to being a female. --- # Linear Regression with Log-transformtion ### <p style="color:#00449E"> Interpreting Beta Estimates - All else being equal, an increase in `AGEP` by one unit is associated with an increase in `log(PINCP)` by `\(\hat{\texttt{b1}}\)`. - All else being equal, an increase in `AGEP` by one unit is associated with an increase in `PINCP` by `\((\texttt{exp(}\hat{\texttt{b1}}\texttt{)} - 1)\)`%. - All else being equal, being a male is associated with an increase in `log(PINCP)` by `\(\hat{\texttt{b2}}\)` relative to being a female. - All else being equal, being a male is associated with an increase in `PINCP` by `\((\texttt{exp(}\hat{\texttt{b2}}\texttt{)} - 1)\)`% relative to being a female. --- class: inverse, center, middle # Linear Regression with Interaction Terms <html><div style='float:left'></div><hr color='#EB811B' size=1px width=796px></html> --- # Linear Regression with Interaction Terms ### <p style="color:#00449E"> Motivation - Does the relationship between education and income vary by gender? - Suppose we are interested in knowing whether women are being compensated unequally despite having the same levels of education and preparation as men do. - How can linear regression address the question above? --- # Linear Regression with Interaction Terms ### <p style="color:#00449E"> Model - The linear regression with an interaction between explanatory variables `\(X_{1}\)` and `\(X_{2}\)` are: `$$Y_{\texttt{i}} \,=\, b_{0} \,+\, b_{1}\,X_{1,\texttt{i}} \,+\, b_{2}\,X_{2,\texttt{i}} \,+\, b_{3}\,X_{1,\texttt{i}}\times \color{Red}{X_{2,\texttt{i}}} \,+\, e_{\texttt{i}},$$` - where - `\(\texttt{i}\;\)`: `\(\;\;\texttt{i}\)`-th observation in the training data.frame, `\(i = 1, 2, 3, \cdots\)`. - `\(Y_{\texttt{i}}\,\)`: `\(\;\texttt{i}\)`-th observation of outcome variable `\(Y\)`. - `\(X_{p, \texttt{i}}\,\)`: `\(\texttt{i}\)`-th observation of the `\(p\)`-th explanatory variable `\(X_{p}\)`. - `\(e_{\texttt{i}}\;\)`: `\(\;\texttt{i}\)`-th observation of statistical error variable. --- # Linear Regression with Interaction Terms ### <p style="color:#00449E"> Model - The linear regression with an interaction between explanatory variables `\(X_{1}\)` and `\(X_{2}\)` are: `$$Y_{\texttt{i}} \,=\, b_{0} \,+\, b_{1}\,X_{1,\texttt{i}} \,+\, b_{2}\,X_{2,\texttt{i}} \,+\, b_{3}\,X_{1,\texttt{i}}\times \color{Red}{X_{2,\texttt{i}}} \,+\, e_{\texttt{i}}$$`. .panelset[ .panel[.panel-name[Interaction] - The relationship between `\(X_{1}\)` and `\(Y\)` varies by values of `\(b_{3}\, X_{2}\)`: `$$\frac{\Delta Y}{\Delta X_{1}} \,=\, b_{1} + b_{3}\, X_{2}$$`. ] .panel[.panel-name[Example] - `\(X_{2}\)` is often an indicator variable. If `\(b_{3} \neq 0\)` and `\(X_{2, \texttt{i}} = 1\)`, `$$\frac{\Delta Y}{\Delta X_{1}} \,=\, b_{1} + b_{3}$$`. ] ] --- # Linear Regression with Interaction Terms ### <p style="color:#00449E"> Motivation - Is education related with income? ```r model <- lm( log(PINCP) ~ AGEP + SCHL + SEX, data = dtrain ) ``` - Does the relationship between education and income vary by gender? ```r model_int <- lm( log(PINCP) ~ AGEP + SCHL + SEX + SCHL * SEX, data = dtrain ) # Equivalently, model_int <- lm( log(PINCP) ~ AGEP + SCHL * SEX, # Use this one! data = dtrain ) ``` --- # Linear Regression with Interaction Terms - How could we see how the relationship between education and income vary by gender? .panelset[ .panel[.panel-name[Code] ```r summary(model_int) b_int <- coef(model_int) # the male's relationship between `Professional degree` and # `PINCP` relative to male with no high school diploma exp( b_int['SCHLProfessional degree'] ) - 1 # the female's relationship between `Professional degree` and # `PINCP` relative to female with no high school diploma exp( b_int['SCHLProfessional degree'] + b_int['SCHLProfessional degree:SEXFemale'] ) - 1 ``` ] .panel[.panel-name[Interpretation] - All else being equal, female's professional degree is associated with an increase in personal income by 259% relative to female with no high school diploma. - All else being equal, male's professional degree is associated with an increase in personal income by 199% relative to male with no high school diploma. ] ] --- class: inverse, center, middle # Log-Log Linear Regression <html><div style='float:left'></div><hr color='#EB811B' size=1px width=796px></html> --- # Log-Log Linear Regression ### <p style="color:#00449E"> Estimating Price Elasticity - To estimate the price elasticity of orange juice (OJ), we will use sales data for OJ from Dominick’s grocery stores in the 1990s. - Weekly `price` and `sales` (in number of cartons "sold") for three OJ brands---Tropicana, Minute Maid, Dominick's - An indicator, `feat`, showing whether each `brand` was advertised (in store or flyer) that week. Variable | Description ----------|------------------------------- `sales` | Quantity of OJ cartons sold `price` | Price of OJ `brand` | Brand of OJ `feat` | Advertisement status --- # Log-Log Linear Regression ### <p style="color:#00449E"> Estimating Price Elasticity - Let's prepare the OJ data: ```r oj <- read_csv('https://bcdanl.github.io/data/dominick_oj.csv') # Split 70-30 into training and testing data.frames set.seed(14454) gp <- runif( nrow(oj) ) dtrain <- filter(oj, [?]) dtest <- filter(oj, [?]) ``` --- # Log-Log Linear Regression ### <p style="color:#00449E"> Estimating Price Elasticity - The following model estimates the price elasticity of demand for a carton of OJ: `$$\log(\texttt{sales}_{\texttt{i}}) \,=\, \quad\;\; b_{\texttt{intercept}} \,+\, b_{\,\texttt{mm}}\,\texttt{brand}_{\,\texttt{mm}, \texttt{i}} \,+\, b_{\,\texttt{tr}}\,\texttt{brand}_{\,\texttt{tr}, \texttt{i}}\\ \,+\, b_{\texttt{price}}\,\log(\texttt{price}_{\texttt{i}}) \,+\, e_{\texttt{i}}$$` - where $$ \texttt{brand}_{\,\texttt{tr}, \texttt{i}}\\ = \begin{cases} \texttt{1} & \text{ if an orange juice } \texttt{i} \text{ is } \texttt{Tropicana};\\\\ \texttt{0} & \text{otherwise}.\qquad\qquad\quad\, \end{cases} $$ $$ \texttt{brand}_{\,\texttt{mm}, \texttt{i}}\\ = \begin{cases} \texttt{1} & \text{ if an orange juice } \texttt{i} \text{ is } \texttt{Minute Maid};\\\\ \texttt{0} & \text{otherwise}.\qquad\qquad\quad\, \end{cases} $$ --- # Log-Log Linear Regression ### <p style="color:#00449E"> Estimating Price Elasticity - The following model estimates the price elasticity of demand for a carton of OJ: `$$\log(\texttt{sales}_{\texttt{i}}) \,=\, \quad\;\; b_{\texttt{intercept}} \,+\, b_{\,\texttt{mm}}\,\texttt{brand}_{\,\texttt{mm}, \texttt{i}} \,+\, b_{\,\texttt{tr}}\,\texttt{brand}_{\,\texttt{tr}, \texttt{i}}\\ \,+\, b_{\texttt{price}}\,\log(\texttt{price}_{\texttt{i}}) \,+\, e_{\texttt{i}}$$` - When `\(\texttt{brand}_{\,\texttt{tr}, \texttt{i}}\,=\,0\)` and `\(\texttt{brand}_{\,\texttt{mm}, \texttt{i}}\,=\,0\)`, the beta coefficient for the intercept `\(b_{\texttt{intercept}}\)` gives the value of Dominick's log sales at `\(\log(\,\texttt{price[i]}\,) = 0\)`. - The beta coefficient `\(b_{\texttt{price}}\)` is the price elasticity of demand. - It measures how sensitive the quantity demanded is to its price. --- # Log-Log Linear Regression ### <p style="color:#00449E"> Estimating Price Elasticity - For small changes in variable `\(x\)` from `\(x_{0}\)` to `\(x_{1}\)`, the following equation holds: `$$\Delta \log(x) \,= \, \log(x_{1}) \,-\, \log(x_{0}) \approx\, \frac{x_{1} \,-\, x_{0}}{x_{0}} \,=\, \frac{\Delta\, x}{x_{0}}.$$` - The coefficient on `\(\log(\texttt{price}_{\texttt{i}})\)`, `\(b_{\texttt{price}}\)`, is therefore `$$b_{\texttt{price}} \,=\, \frac{\Delta \log(\texttt{sales}_{\texttt{i}})}{\Delta \log(\texttt{price}_{\texttt{i}})}\,=\, \frac{\frac{\Delta \texttt{sales}_{\texttt{i}}}{\texttt{sales}_{\texttt{i}}}}{\frac{\Delta \texttt{price}_{\texttt{i}}}{\texttt{price}_{\texttt{i}}}}.$$` - All else being equal, an increase in `\(\texttt{price}\)` by 1% is associated with a decrease in `\(\texttt{sales}\)` by `\(b_{\texttt{price}}\)`%. --- # Log-Log Linear Regression ### <p style="color:#00449E"> EDA .pull-left[ - Describe the relationship between `brand` and `log(price)`. ```r ggplot(dtrain, aes( x = [?], y = [?], fill = [?]) ) + geom_boxplot() ``` ] .pull-right[ - Describe the relationship between `log(price)` and `log(sales)` by `brand`. ```r ggplot(dtrain, aes(x = [?], y = [?], color = [?])) + geom_point([?]) + geom_smooth(method = [?]) ``` ] --- # Log-Log Linear Regression ### <p style="color:#00449E"> Estimating Price Elasticity - Let's train the first model, `model_1`: `$$\log(\texttt{sales}_{\texttt{i}}) \,=\, \quad\;\; b_{\texttt{intercept}} \,+\, b_{\,\texttt{mm}}\,\texttt{brand}_{\,\texttt{mm}, \texttt{i}} \,+\, b_{\,\texttt{tr}}\,\texttt{brand}_{\,\texttt{tr}, \texttt{i}}\\ \,+\, b_{\texttt{price}}\,\log(\texttt{price}_{\texttt{i}}) \,+\, e_{\texttt{i}}$$` ```r model_1 <- lm([?], data = dtrain) ``` --- # Log-Log Linear Regression ### <p style="color:#00449E"> Estimating Price Elasticity - Here is the inverse demand curve for each brand OJ: .pull-left[ <!-- --> ] .pull-left[ - When `\(\texttt{brand}_{\,\texttt{tr}, \texttt{i}}\,=\,0\)` and `\(\texttt{brand}_{\,\texttt{mm}, \texttt{i}}\,=\,0\)`, the beta coefficient `\(b_{\texttt{intercept}}\)` gives the value of Dominick's log sales at `\(\log(\,\texttt{price[i]}\,) = 0\)`. ] --- # Log-Log Linear Regression ### <p style="color:#00449E"> Estimating Price Elasticity - How does the relationship between `log(sales)` and `log(price)` vary by `brand`? - Let's train the second model, `model_2`, that addresses the above question: `$$\log(\texttt{sales}_{\texttt{i}}) \,=\, \quad b_{\texttt{intercept}} \,+\, b_{\,\texttt{mm}}\,\texttt{brand}_{\,\texttt{mm}, \texttt{i}} \,+\, b_{\,\texttt{tr}}\,\texttt{brand}_{\,\texttt{tr}, \texttt{i}}\\ \,+\, b_{\texttt{price}}\,\log(\texttt{price}_{\texttt{i}}) \\ \qquad\qquad\qquad\,+\, b_{\texttt{price*mm}}\,\log(\texttt{price}_{\texttt{i}})\,\times\,\color{Red} {\texttt{brand}_{\,\texttt{mm}, \texttt{i}}} \\ \qquad\qquad\qquad\qquad +\, b_{\texttt{price*tr}}\,\log(\texttt{price}_{\texttt{i}})\,\times\,\color{Red} {\texttt{brand}_{\,\texttt{tr}, \texttt{i}}} \,+\, e_{\texttt{i}}$$` ```r model_2 <- lm([?], data = dtrain) ``` --- # Log-Log Linear Regression ### <p style="color:#00449E"> Estimating Price Elasticity - Here are the inverse demand curves from `model_1` and `model_2`: .pull-left[ 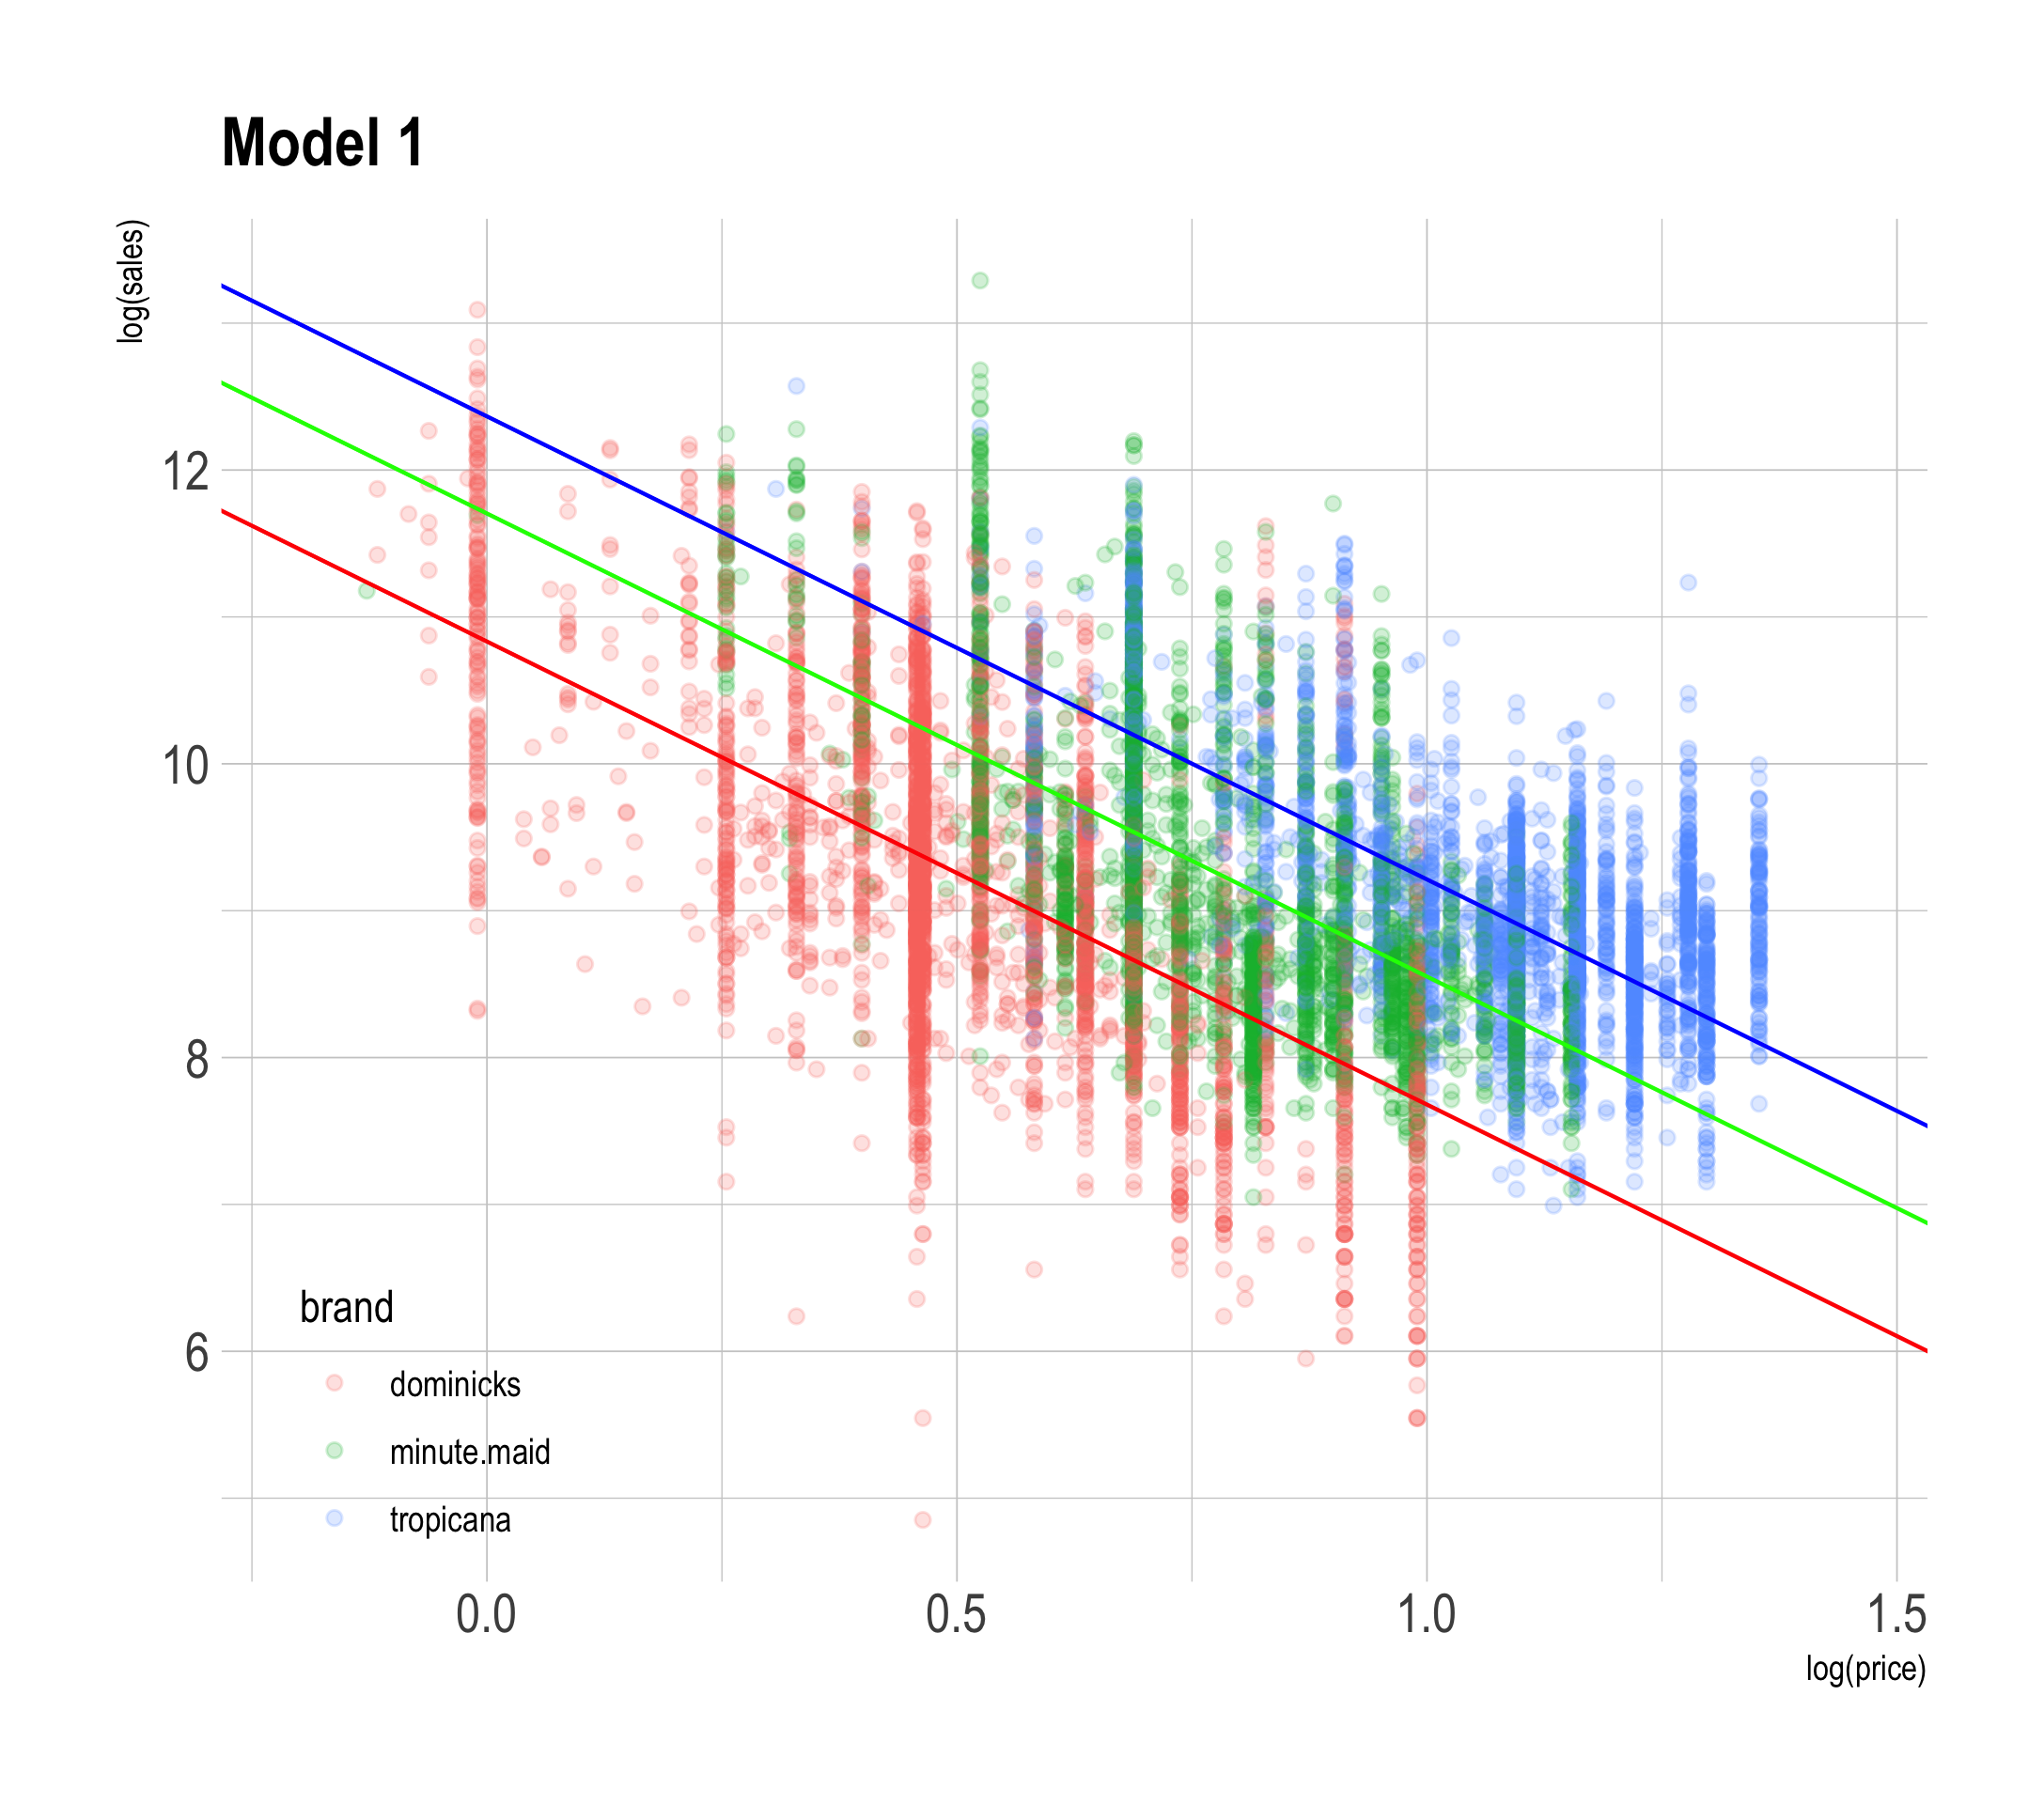<!-- --> ] .pull-right[ 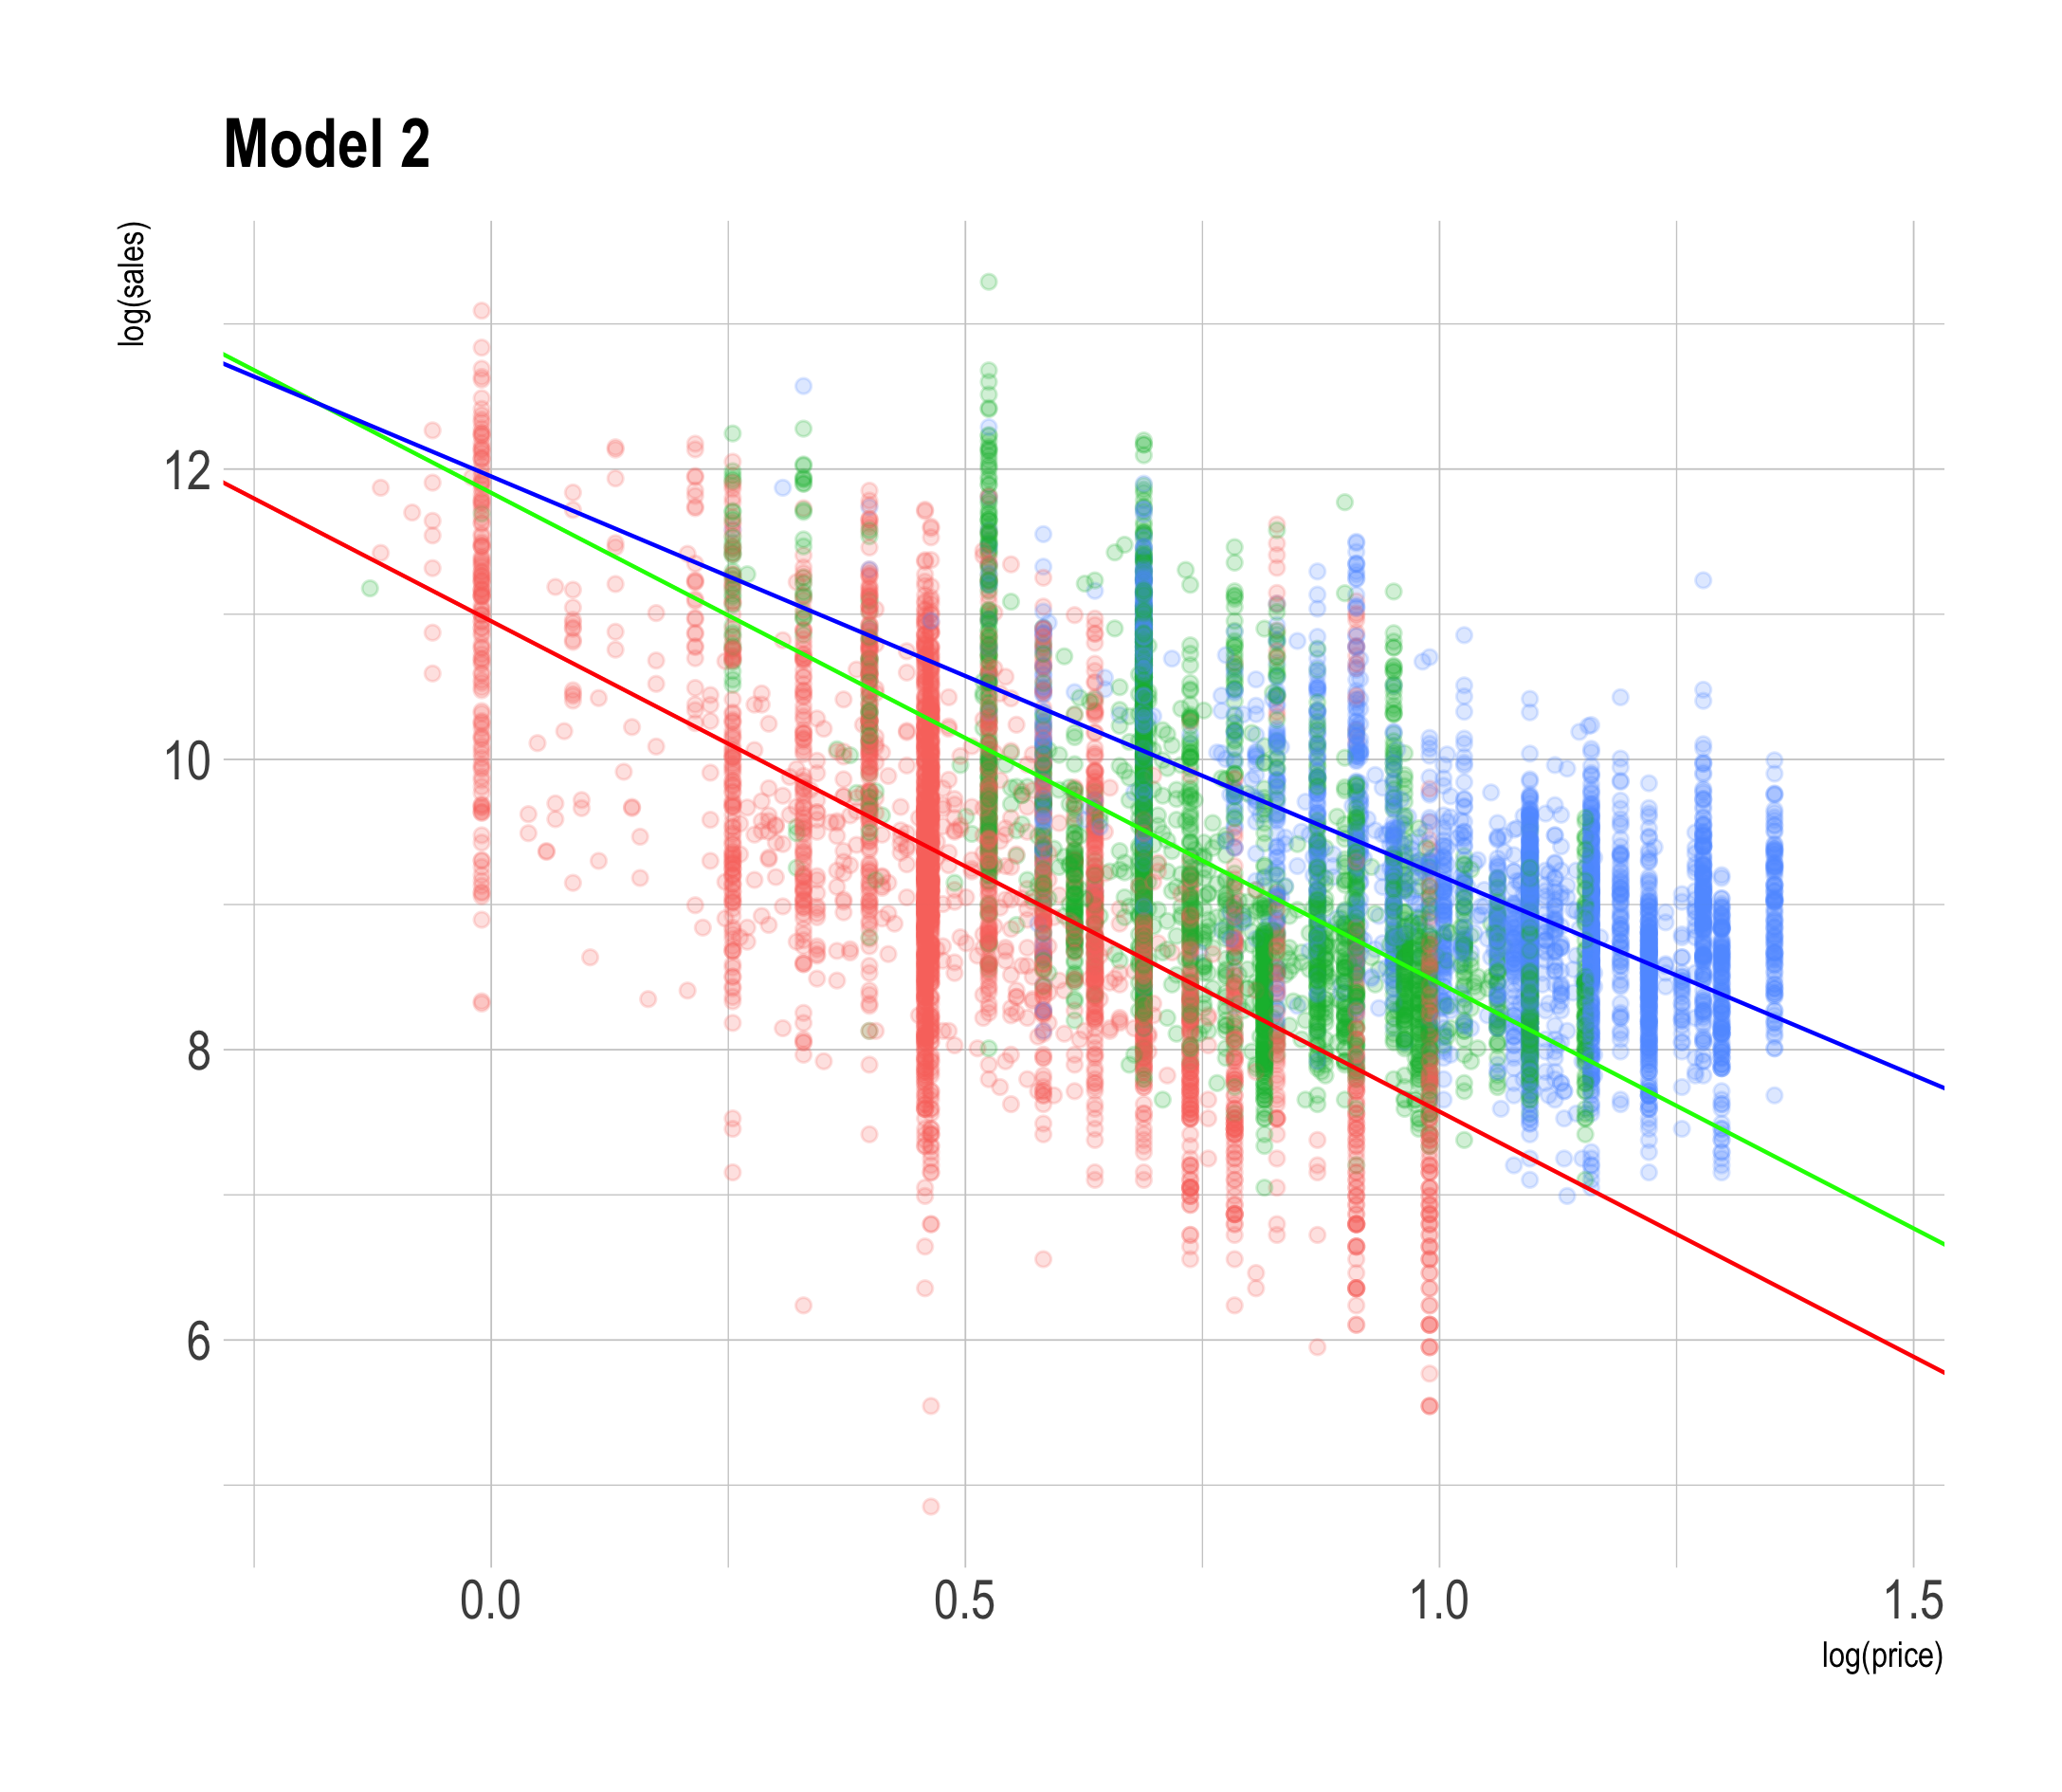<!-- --> ] - Model 2 assumes that the price elasticity of OJ can vary by `brand`. --- # Log-Log Linear Regression - How does advertisement play a role in the relationship between sales and prices in the OJ market? - Let's train the second model, `model_3`, that addresses the above question: `$$\log(\texttt{sales}_{\texttt{i}}) \,=\, \quad b_{\texttt{intercept}} \,+\, b_{\,\texttt{mm}}\,\texttt{brand}_{\,\texttt{mm}, \texttt{i}} \,+\, b_{\,\texttt{tr}}\,\texttt{brand}_{\,\texttt{tr}, \texttt{i}}\\ \,+\, b_{\texttt{price}}\,\log(\texttt{price}_{\texttt{i}}) \\ \qquad\qquad\qquad\,+\, b_{\texttt{price**mm}}\,\log(\texttt{price}_{\texttt{i}})\,\times\,\color{Red} {\texttt{brand}_{\,\texttt{mm}, \texttt{i}}} \\ \qquad\qquad\qquad\,+\, b_{\texttt{price**tr}}\,\log(\texttt{price}_{\texttt{i}})\,\times\,\color{Red} {\texttt{brand}_{\,\texttt{tr}, \texttt{i}}} \\ \qquad\qquad\quad +\, b_{\,\texttt{feat}}\,\texttt{feat}_{\, \texttt{i}}\,+\, b_{\texttt{price*feat}}\,\log(\texttt{price}_{\texttt{i}})\,\times\,\color{Blue}{\texttt{feat}_{\,\texttt{i}}} \\ \qquad\qquad\quad +\, b_{\texttt{price*mm*feat}}\,\log(\texttt{price}_{\texttt{i}}) \,\times\,\,\color{Red} {\texttt{brand}_{\,\texttt{mm}, \texttt{i}}}\,\times\, \color{Blue}{\texttt{feat}_{\,\texttt{i}}} \\ \qquad\qquad\qquad\quad +\, b_{\texttt{price*tr*feat}}\,\log(\texttt{price}_{\texttt{i}}) \,\times\,\,\color{Red} {\texttt{brand}_{\,\texttt{tr}, \texttt{i}}}\,\times\, \color{Blue}{\texttt{feat}_{\,\texttt{i}}} \,+\, e_{\texttt{i}}$$` ```r model_3 <- lm([?], data = dtrain) ``` --- # Log-Log Linear Regression ### <p style="color:#00449E"> Estimating Price Elasticity - Here are the inverse demand curves from `model_3`: .pull-left[ 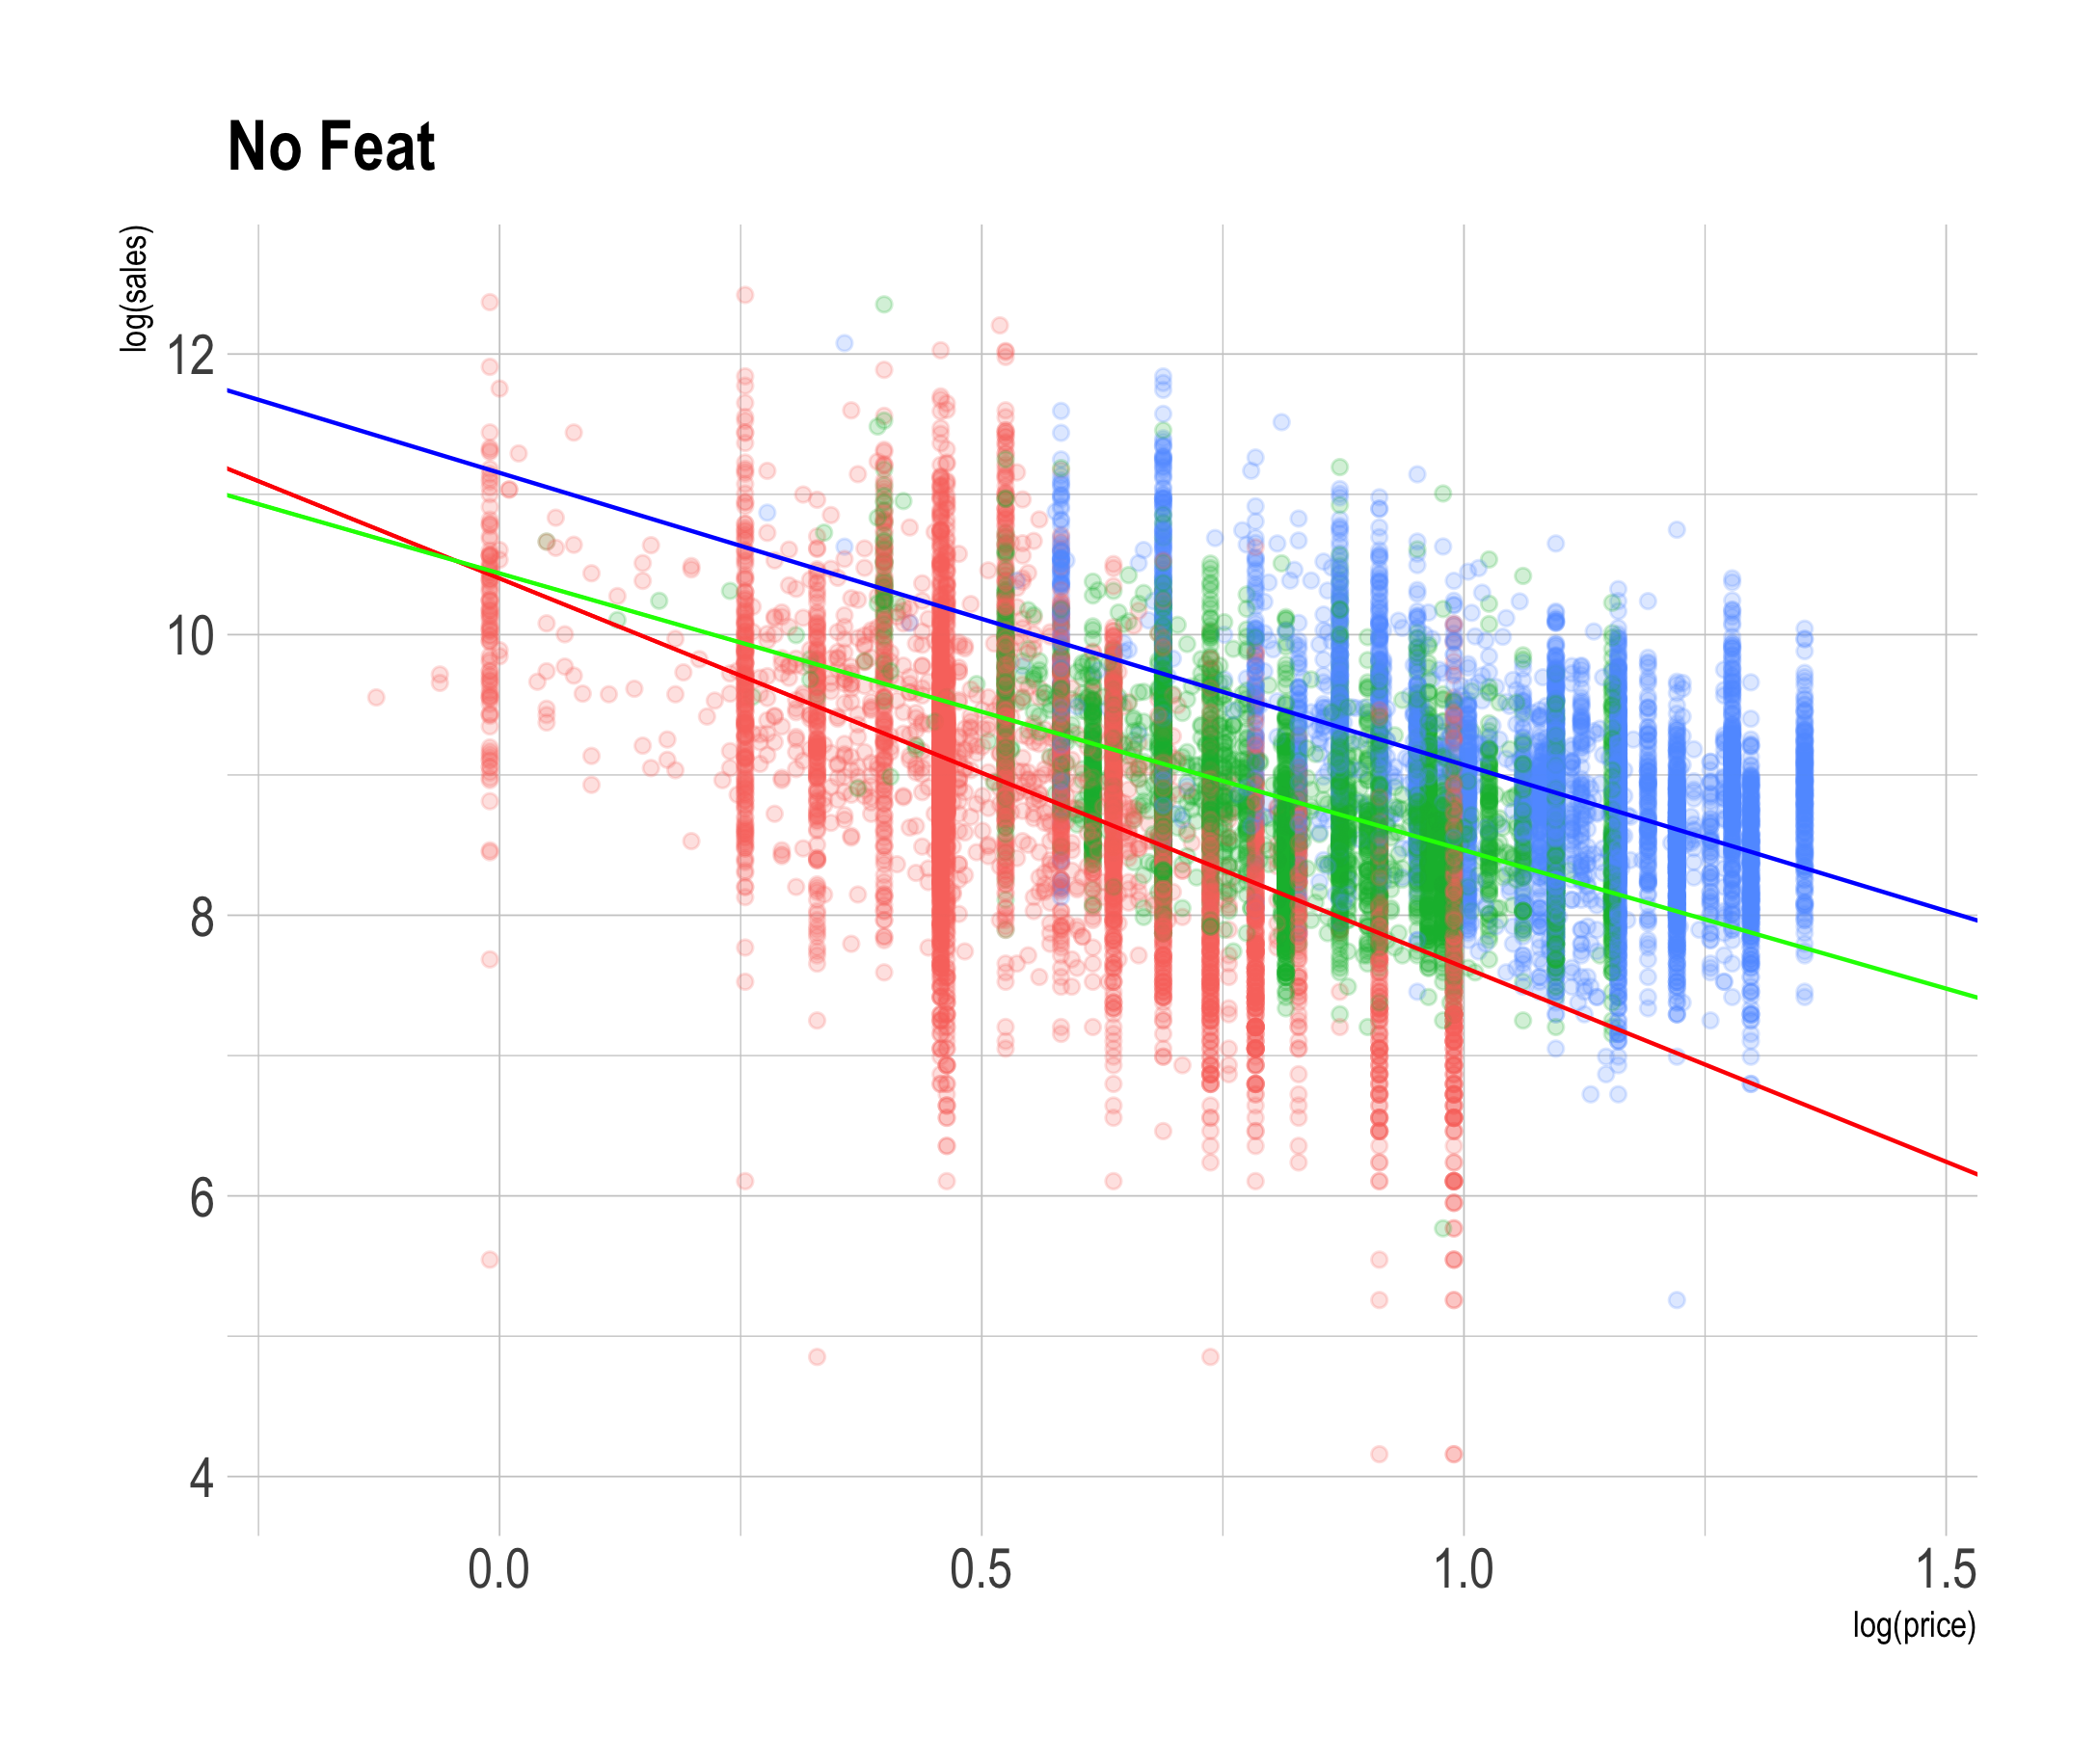<!-- --> ] .pull-right[ <!-- --> ] --- # Log-Log Linear Regression ### <p style="color:#00449E"> Estimating Price Elasticity - Describe the relationship between `feat` and `brand` using stacked bar charts. .pull-left[ <!-- --> ] .pull-right[ <!-- --> ] - Model 3 assumes that the relationship between `price` and `sales` can vary by `feat`. --- # Log-Log Linear Regression ### <p style="color:#00449E"> Estimating Price Elasticity <img src="../lec_figs/oj_elasticity.png" width="70%" style="display: block; margin: auto;" /> - How would you explain different estimation results across different models? - Which model do you prefer? Why?